Compounding Illustration
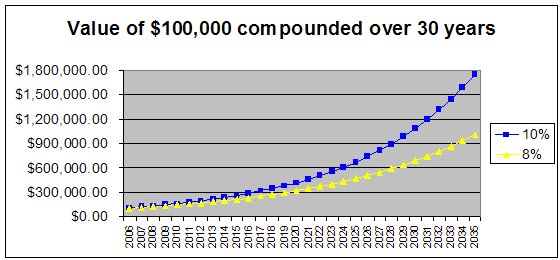
The chart embedded here is a simple illustration of the power of compounding. It reflects the difference over time between an 8% growth rate and a 10% growth rate. Additional assumptions include a 30 year time horizon, and a starting amount of $100,000, with no additional contributions.
At the end of thirty years, the $100,000 grows to:
- $1,006,266 at 8%
- $1,744,940 at 10%
- $2,995,992 at 12%! (not shown in the chart)
This illustrates a couple of basic tenets of wealth-building: start early, and select investments with high growth rates. The latter is far less predictable, but it can be buffered by the former in the sense that the longer your investment time horizon, the more room you have for error.
posted by ChicagoInTheDesert @ 12:01 PM
0 comments
![]()
![]()


